Understanding the distinction between service and data health is vital for cloud-native applications to guarantee data reliability and user trust.
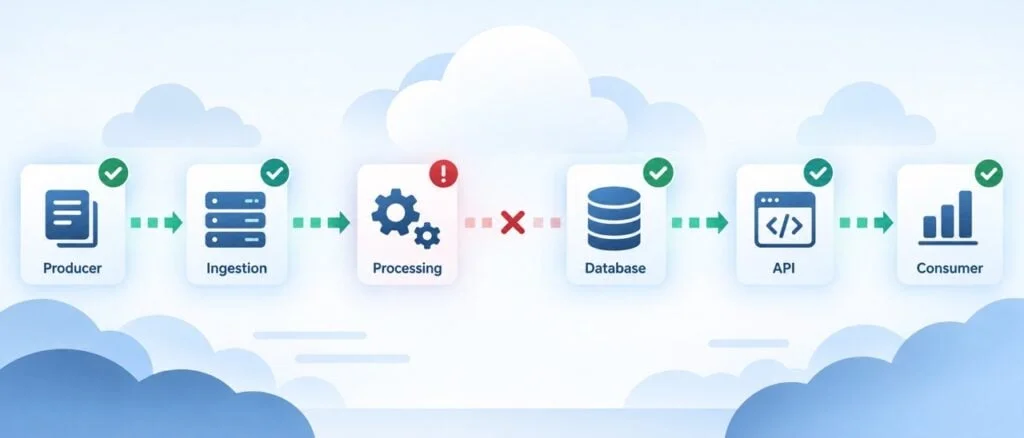
In the realm of cloud-native applications, an intriguing challenge commonly emerges: a service may be technically operational, yet it can fail in delivering timely updates, compromising user experience. Users can report discrepancies even when monitoring dashboards indicate everything is functioning smoothly. This scenario highlights a critical divergence in cloud environments: service health and data health don’t always align.
A Disconnect Between Monitoring and Reality
Consider a straightforward data flow model: Producer → Ingestion → Processing → Database → API → Consumer. Even if the producer halts sending updates, components downstream—like the ingestion service, database, and API—might still report green health statuses. This lack of a real-time data assessment can mask significant issues in data delivery.
The traditional approach to infrastructure monitoring predominantly focuses on whether services can respond to requests, overlooking a crucial aspect: the currency of the information being delivered. The absence of updates can impede a user's ability to rely on the service, creating a scenario where users interact with outdated data, leading to distrust.
Data Freshness as a Health Indicator
To address this gap, it’s essential to consider data freshness as a metric of application health. This means encapsulating user expectations for how frequently information should refresh and comparing it to the actual update intervals. For instance, if a system generally updates every 30 seconds, a single missed cycle may not constitute an issue. However, accumulating delays should trigger a reevaluation of the service status.
Determining the acceptable freshness threshold varies greatly depending on the application’s workload—drawing distinctions between real-time data and periodic batch updates is necessary for correctly interpreting data staleness.
Recognizing Intermediate States
One common pitfall is categorizing every lag in data updates as a full-scale outage. In cases where a data source is delayed, simply rebooting a service may not resolve the underlying issue. Instead, it’s prudent to acknowledge varying levels of data health, such as moving from healthy to degraded and, eventually, to stale. This nuanced understanding enables teams to manage their responses effectively.
Different end-user experiences call for adaptable design—while a dashboard might continue displaying the last known value, it should also inform users when fresh updates are delayed. Meanwhile, automated alerts can be escalated only when staleness persists beyond expected thresholds.
Comprehensive Flow Monitoring
Cloud-native frameworks offer significant visibility into services and infrastructure, yet they often fall short in monitoring the actual flow of data. It's not just about verifying the individual components; the focus should also extend to whether information continues to traverse the system smoothly.
Key indicators to monitor include:
- Last successful update: Most recent timestamp of new information receipt.
- Data age: The duration since the latest update.
- Expected frequency: How often updates are typically anticipated.
- Processing lag: Any unexpected delays in moving information through the pipeline.
- Duration in degraded state: Assessing whether a delay is a transient issue or a persistent problem.
Analyzing these metrics together can lead to quicker insights, directing engineers to investigate pipeline stages rather than wasting resources on healthy operational checks.
Streamlined Alert Management
Implementing freshness monitoring often leads to an influx of alerts, creating another challenge. Not every missed update warrants immediate action; operational interruptions can be short-lived. Over-alerting can induce alert fatigue among teams, leading to critical notifications being ignored.
A strategic approach is required to balance alerting with severity and duration. For instance, a brief delay can transition a service into a degraded state without triggering high-priority alerts. Conversely, if delays accumulate over multiple intervals, then appropriate actions should be initiated based on escalated alerting protocols.
Designing Freshness Into the Architecture
Ultimately, to integrate freshness monitoring effectively, it must be an intrinsic part of the application architecture rather than a retrofitted solution after experiencing issues. Data producers are urged to implement timestamps or sequence numbers that help consumers assess the progression of information. Further, processing stages should make their latest successful activities visible, allowing APIs to provide context regarding data currency.
As applications scale, particularly when numerous services exist along the data pipeline, each component may report operational health even when problems are occurring upstream. Thus, holistic health indicators must account for the entire data journey, ensuring alignment between service availability and data reliability.
Redefining Application Health
While liveness checks ascertain whether processes run and readiness checks determine service traffic acceptance, cloud-native environments require an additional health dimension: Is the information users receive current enough to be deemed reliable?
Extending traditional health checks to embrace data freshness won’t eliminate current assessment practices; rather, it enhances them to meet user expectations. A service might be fully operational yet deliver outdated data. The key takeaway is clear: a healthy service should have mechanisms to recognize when its data integrity is compromised.



Discussion
Sign in to join the discussion.