Reassessing autoscaling strategies reveals queue latency as a superior metric for synchronous web applications over traditional CPU-based methods.
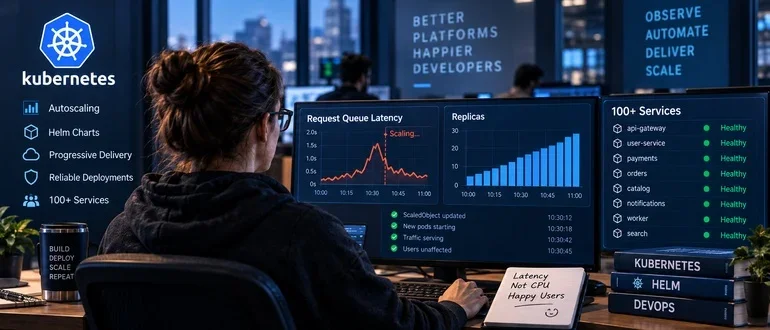
When it comes to managing autoscaling for Rails applications, especially within a Kubernetes environment, relying solely on CPU and memory can lead to significant delays in scaling, leaving users experiencing timeouts and errors. It’s essential to consider more effective metrics that act proactively instead of reactively.
The Core Problem
Every Kubernetes guide seems to gloss over complexities faced by larger platforms with multiple services and diverse technologies. In practice, managing over 100 services running different languages and deployment strategies complicates the autoscaling process immensely. Teams often resort to drafting their own deployment configurations but this often leads to inconsistency and inefficiency.
A primary challenge arises in how different services are monitored and scaled; inconsistencies in autoscaling rules mean that a single spike in traffic could overwhelm one service while another remains idle. This lack of standardization leads to unpredictable performance during high-demand periods.
Understanding the Metrics
Traditionally, developers have been guided to scale based on the CPU or memory usage of their applications. However, these figures can be misleading in the context of synchronous web applications. They tend to be lagging indicators that do not account for the immediate experiences of users. By the time CPU usage rises significantly, the application may already be failing to meet user demand.
What becomes more telling is the concept of queue latency. This metric details how long requests wait before being handled, directly correlating to user experience. When requests begin to queue up, that’s the moment a developer should consider scaling, as opposed to waiting for CPU usage to reflect the increased load. This transition to focusing on queue latency can drastically reduce wait times and improve the responsiveness of the application.
Implementing Queue Latency Scaling
In our application setup, transitioning to scale based on queue latency involved configuring KEDA (Kubernetes Event-driven Autoscaling) to monitor request latency. Using metrics from services like Datadog, we could effectively pinpoint latency thresholds that trigger autoscaling events. For instance, if the queue latency exceeds a specific value—say 500 milliseconds—this signals to scale up the number of active workers immediately.
A websocket or HTTP server setup reporting queue latency can easily integrate into the autoscaling mechanisms. For example:
StatsD.distribution(
  'custom.unicorn.queue_latency',
  queue_time_ms,
  tags: ["service:#{{service_name}}", "env:#{{environment}}"]
)
This setup allows for quick reaction times, ensuring that the scaling events happen before any errors impact the user experience. Additionally, incorporating a fallback mechanism safeguards against metrics provider failures, eliminating downtime by defaulting to a safe number of replicas.
Addressing Different Workload Types
It’s important to note that while queue latency is ideal for synchronous web applications, other types of workloads require different metrics. For background workers, including systems like Sidekiq, focusing on queue depth provides a more relevant signal. The nature of asynchronous jobs means that individual job delays do not directly affect user experience, making job backlog a more appropriate metric to manage.
Standardizing Safe Deployments
Another area of improvement in our infrastructure has been to standardize deployment practices. The need for safe, predictable deployments cannot be underestimated. Utilizing Helm charts has allowed us to encode deployment rules, including pod disruption budgets and health checks, directly into the deployments.
By making best practices the default, every deployment is safer. We've set up a canary deployment process where new changes gradually roll out to a small portion of users first—this significantly lowers the risk of errors going unnoticed.
Ownership and Visibility
Visibility and ownership are pivotal in effectively maintaining a microservices architecture. Our Helm charts automatically apply labels for service identification, allowing traffic incidents to be quickly assigned to the correct on-call personnel. Each service deployment becomes traceable and easily observable, enhancing operational accountability.
Scaling Insights for Future Growth
As we continue to scale up services to over 100, the importance of consistently high-quality defaults becomes clear. Resources like PDBs and automatic health checks should not require individual configuration; they should be built into each service’s deployment pipeline to ensure seamless operational integrity.
Ultimately, the objective should be to minimize the number of decisions developers have to make. Every decision not made is a potential error avoided, and as teams continue to grow, creating a platform that centralizes these practices becomes invaluable for managing complexity efficiently.
By shifting our framing around autoscaling from reliance on CPU and memory metrics to direct signals of user experience, like queue latency, the application not only becomes more resilient but also significantly enhances user satisfaction.



Discussion
Sign in to join the discussion.