Quarkus Contribution City maps GitHub activity onto a skyline, with a scheduled GitHub Action refreshing the SVG each night.
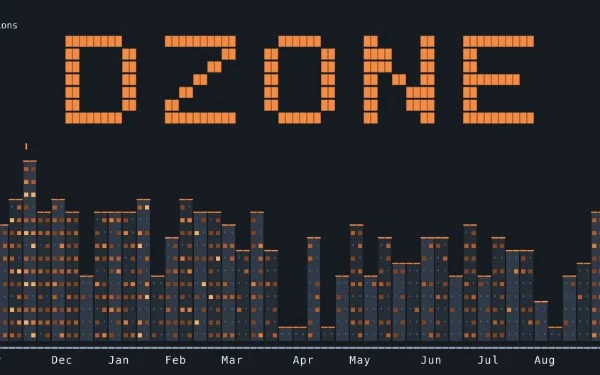
A contribution calendar with a different silhouette
Quarkus Contribution City gives GitHub’s familiar activity calendar a new form: an SVG skyline where each week becomes part of a city, and busier weeks rise higher. The underlying record still comes from GitHub contribution data, but the visual emphasis shifts from colored squares to height and shape. A profile’s activity becomes something closer to a miniature cityscape than a grid.
That change is more than a cosmetic swap. A calendar is efficient because it packs many days into a compact, regular pattern. Its strength is precision: you can scan individual squares and compare activity across the year. A skyline trades some of that immediate day-by-day clarity for a broader impression of rhythm. Quiet periods can appear as lower stretches; active ones can form taller sections. The result invites a different kind of reading.
It’s a small project with a clear premise. Make a public activity record more visually distinctive, while keeping it tied to data people already recognize from GitHub. The idea doesn’t need to claim that a skyline is a better measure of software work. It’s a new presentation of the same general record.
How the visual translation works
The project generates an SVG image from GitHub contribution data, with each week represented as part of the skyline and busier weeks rising higher. SVG is a vector image format, so its shapes are described rather than stored as a fixed grid of pixels. That makes it a natural fit for a graphic built from repeated forms: the image can be displayed at different sizes while retaining crisp edges.
The mapping from activity to height is the key design choice. In a conventional contribution calendar, color intensity often signals how much activity a day represents. Here, the project’s description puts the emphasis on weekly activity and vertical height. That gives the image a stronger silhouette, but it also changes what the viewer notices first. A tall section stands out immediately; a subtle difference between two nearby weeks may be harder to judge than it would be in a color-coded grid.
That’s a familiar trade-off in data visualization. A chart can make a pattern easier to see while making some details less explicit. The skyline can communicate variation across the year at a glance, but it shouldn’t be mistaken for a complete account of what someone did, how difficult the work was, or how valuable it proved. Contribution records describe activity captured by the source data. They don’t explain the work behind it.
And yet, the visual format has a practical appeal: it makes a profile graphic feel more personal. A familiar calendar can be read as a status display; a skyline gives that same history a recognizable shape.
From Java and Quarkus to a generated image
Quarkus Contribution City is built with Java and Quarkus. The source identifies those technologies and says the project generates the image from GitHub contribution data. That’s enough to place it in a useful category: a small application that turns structured information into a graphic people can publish or view, with automation keeping the result refreshed.
Quarkus is the framework named in the project itself, while Java is the language used to build it. The article doesn’t provide implementation details about how the data is retrieved, how the image is assembled, or what configuration the project requires. Those distinctions matter to anyone evaluating the code. The project’s stated purpose is clear; its precise internal design would need to be assessed by looking at the repository.
The generated SVG also separates the data transformation from the places where the image might be viewed. A graphic file can be displayed in a profile or another page that supports it, without requiring the viewer to interact with the application that produced it. That’s a common advantage of generated images: once created, the output can travel more easily than the process that made it.
Still, a generated graphic is only as useful as its source data and update routine. If the input changes, the image needs to be regenerated. If the generation process stops, the visible result can become stale. In this project, a scheduled GitHub Action refreshes the image nightly, linking the data-to-image process to a recurring automated run.
Automation keeps the picture current
A nightly schedule gives the project a simple operating model. Rather than asking someone to rebuild the image after every change in activity, the GitHub Action runs on a recurring basis and refreshes the output. The image is therefore designed to keep pace with the annual contribution record as that record changes.
That schedule is a practical compromise. Contribution data doesn’t need a live update every second to make a profile graphic useful, so a recurring refresh can keep the result current without turning the display into a continuously updating feed. The source doesn’t describe the workflow’s failure handling or exact publication steps, so those details shouldn’t be assumed. The stated behavior is the nightly refresh.
(And this is the part most people overlook.) Automation makes the image feel effortless to the viewer, but it adds a dependency behind the scenes: the scheduled task has to run, access the required data, and produce an updated file. For a small project, that’s a useful reminder that even a simple visual feature includes a maintenance path.
Inspiration, attribution, and the project’s scope
The visual inspiration comes from Pink Pixel's skyline. That connection places Quarkus Contribution City within a broader pattern of turning contribution histories into alternative graphics. The source doesn’t describe the relationship in greater detail, so it’s best understood as an acknowledged source of visual inspiration rather than a claim about shared code or identical behavior.
You can view the project at Quarkus Contribution City and see it populated with real activity on the creator's GitHub profile. Those links give readers two different ways to understand it: the repository presents the project, while the profile shows the skyline in use with actual contribution data.
This is more significant than it looks as a small example of presentation shaping how people encounter developer activity. A contribution calendar is already a highly compressed account. Recasting it as a city makes the record more memorable, but the graphic remains a representation of recorded contributions, not a full portrait of someone’s work.
What the skyline can and can’t say
For a reader browsing a profile, the skyline offers an immediate visual summary. You don’t need to know Java or Quarkus to understand the central idea: weeks with more activity rise higher, and the year takes on a built-up outline. The image can make a profile stand apart from the standard calendar presentation while preserving a connection to the same underlying kind of history.
If you're working in this space, the interesting design question is how much the visualization should explain. A skyline is evocative, but viewers may not know whether height corresponds to a precise count, a range, or another transformation unless the project makes that clear. The source establishes the broad relationship between busier weeks and greater height, but it doesn’t specify the scale. That limits how carefully a viewer can compare particular sections.
One small change in presentation. A different way to notice a year’s activity.
For now, Quarkus Contribution City is best read as a focused project: Java and Quarkus generate an SVG from GitHub contribution data, and a nightly GitHub Action refreshes it. Its value is in giving a familiar record a distinct form. Whether that form is more informative depends on what the viewer wants to see: the calendar’s compact detail, or the skyline’s broader pattern.



Discussion
Sign in to join the discussion.